Kubeshark - Kubernetes Network Observability
Think Wireshark—reimagined for Kubernetes. Capture every packet, inspect every API call, and investigate ongoing and past incidents with complete traffic history—all with minimal production overhead.
Kubeshark delivers cluster-wide, real-time, identity and protocol-aware, visibility into API (L7) and L4 (TCP, UDP, SCTP) traffic, including encrypted (TLS) payloads, as it flows through your containers, pods, namespaces, nodes, and clusters.
Investigate network data with AI-powered natural language prompts. Identify anomalies, detect security threats, optimize costs and improve performance, like never before.
Why Kubeshark?
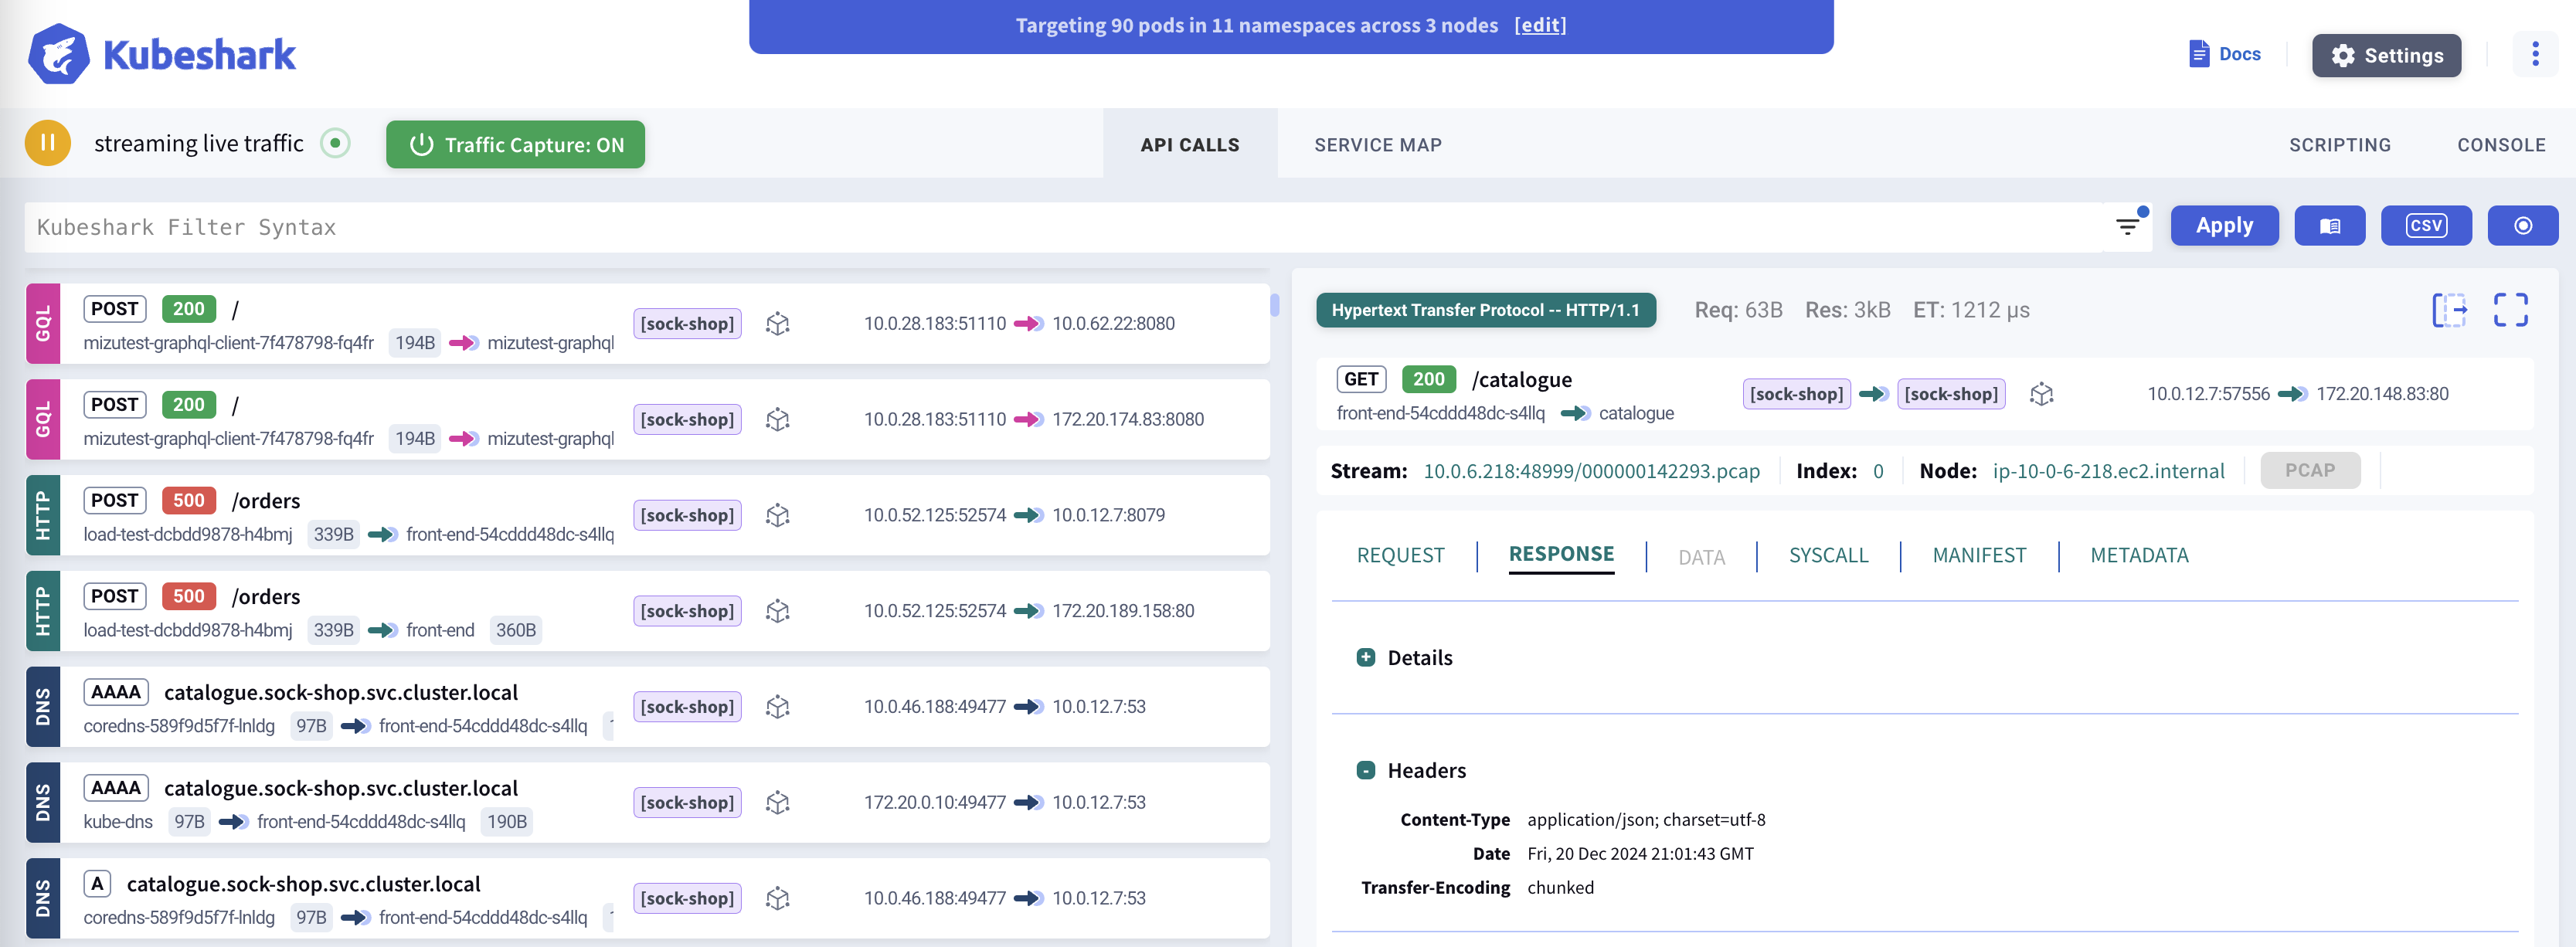
Real-Time API Visibility
Inspect real-time, cluster-wide API calls with full Kubernetes and operating system contexts. Troubleshoot your applications, trace service dependencies, and accelerate root cause analysis.
Complete Packet Retention
An alternative to tcpdump. Kubeshark continuously captures cluster-wide traffic with minimal overhead—always on, zero setup. Export as PCAP for analysis in Wireshark.
AI-Powered Traffic Analysis
Ask any question about your network data using natural language prompts. For example: "Which APIs violate their OAS specs?" or "What services show poor health?"—instant answers.
Forensic Investigation
Investigate ongoing or past incidents. Go back in time and replay the exact network state—every API call, payload, and error at the moment of the incident. Never lose a packet. Always have answers.
What’s New in v2.00
v2.00 introduces a fundamentally new architecture that delivers deep packet inspection with minimal production impact.
| Feature | Benefit |
|---|---|
| Complete L4 Traffic Retention | Never miss a packet—all network flows are captured and stored for later inspection |
| Delayed Dissection | Resource-intensive L7 analysis happens off-production, keeping your nodes lean |
| Improved Reliability | Significant improvements in API dissection accuracy through extensive bug fixes |
| AI-Ready (MCP Server) | Expose raw traffic and insights to AI tools for intelligent analysis |
How It Works
Kubeshark offers two powerful modes for different use cases:
Real-Time API Dissection
See traffic as it happens. Kubeshark captures and dissects API calls in real-time, giving you immediate visibility into what’s happening across your cluster. This is ideal for:
- Live debugging - Diagnose issues as they occur
- Root cause analysis - See the exact request/response that caused a failure
- Development workflows - Watch API calls while testing
Traffic Recording & Deferred Analysis
For comprehensive forensics, Kubeshark can capture complete L4 traffic (PCAP) and analyze it later:
  CAPTURE          STORE           ANALYZE          ENRICH
     |                |                |                |
     v                v                v                v
Lightweight      Complete PCAP    L7 dissection    Kubernetes
L4 capture  ---> retained for ---> on-demand or ---> context
on prod nodes    full history     scheduled        added
This enables:
- Complete traffic history for forensic investigation
- Minimal production overhead when you don’t need real-time analysis
- Long-term retention for compliance and auditing
Protocol Support
Kubeshark supports 20+ protocols across multiple layers, with automatic TLS decryption:
| Category | Protocols |
|---|---|
| HTTP/REST | HTTP/1.0, HTTP/1.1, HTTP/2, WebSocket, GraphQL |
| Messaging | Apache Kafka, AMQP (RabbitMQ), Redis |
| RPC | gRPC over HTTP/2 |
| Authentication | LDAP, RADIUS, DIAMETER |
| Network | DNS, ICMP, TCP, UDP, SCTP |
| Security | TLS (with automatic decryption) |
TLS Decryption: Kubeshark can intercept encrypted traffic without requiring access to private keys by hooking into runtime cryptographic libraries (OpenSSL, Go crypto/tls, BoringSSL).
View full protocol documentation →
AI Integration
Kubeshark connects AI assistants directly to your network data via the Model Context Protocol (MCP)—the open standard for AI tool integration.
What This Enables
Natural Language Queries
Ask questions in plain English instead of writing complex queries. "Show me all failed requests to the payment service in the last hour"—the AI handles the rest.
AI-Driven Investigation
The AI doesn't just fetch data—it analyzes patterns, correlates errors with causes, and suggests root causes based on network evidence.
Closed-Loop Development
AI coding tools (Claude Code, Cursor) can deploy code, then use Kubeshark to verify it works correctly—catching integration bugs before they reach production.
Full Kubernetes Context
Every query includes pod names, services, namespaces, and labels. The AI understands your infrastructure, not just raw IPs and ports.
Example Prompts
| Use Case | Example |
|---|---|
| Incident Investigation | “Something broke at 2pm. Show me what failed and why.” |
| Architecture Discovery | “Map out how services communicate. What calls what?” |
| Security Analysis | “Find all requests without authentication headers.” |
| Performance Debugging | “Why is checkout slow? Where is time being spent?” |
| Compliance | “Export traffic from the payments namespace for the audit.” |
The Bridge to Production
Kubeshark doesn’t write code—it bridges the gap between AI coding tools and production reality. When AI assistants can see actual network behavior, they can:
- Verify code works correctly before release
- Identify integration bugs that unit tests miss
- Fix issues based on real evidence, not guesswork
Learn more about AI Integration →
Quick Start
Get Kubeshark running in 60 seconds:
# Add the Helm repository
helm repo add kubeshark https://helm.kubeshark.com

# Install Kubeshark
helm install kubeshark kubeshark/kubeshark
Then open the dashboard:
kubectl port-forward svc/kubeshark-front 8899:80Open http://localhost:8899 in your browser.
Key Capabilities
| Capability | Description |
|---|---|
| Raw Capture | Continuous L4 packet capture with minimal CPU overhead |
| Traffic Snapshots | Freeze historical traffic before it’s recycled |
| Real-time Dissection | Live L7 protocol analysis as traffic flows |
| Delayed Dissection | Run L7 analysis on captured traffic using non-production compute |
| AI-Powered Analysis | Query network data using natural language via MCP |
| TLS Decryption | See encrypted traffic in plaintext without certificates |
| L4/L7 Workload Map | Visualize service dependencies and traffic flows |
| Service Mesh Support | Native Istio, Linkerd integration with mTLS visibility |
Next Steps
- Installation Guide - Detailed setup instructions
- Dashboard Overview - Learn the Kubeshark interface
- Best Practices - Production deployment tips
- Capture Filters - Target specific traffic